
Debugging background tasks isn’t always easy, and things don't always go our way, but that should not stop us from trying.
We tend to subconsciously believe that things will work out on their own, but in reality, sometimes things break, and they don’t fix themselves.
There is hope! We can choose to be proactive when it comes to these situations and learn how we can get things back on track ourselves.
With the right cron debugger tools provided by Cron To Go, we can efficiently diagnose and resolve issues in our scheduled tasks.
Recognize the signs of broken cron jobs
In order to be adequately prepared, we must be aware of the signs that indicate something is broken. After all, If you don’t know that something is broken, how will you fix it?
With simple cron jobs on a VM or even with Heroku Scheduler, monitoring can be a tedious task. However, with Cron To Go, you have the option to set automated email notifications regarding failed jobs, simplifying the process.
Use Cron To Go’s cron debugger features
In some cases, a job may not fail, but rather just not start, commonly due to issues in Heroku or AWS.
Using Cron To Go’s webhook notifications can help you recognize the root of the problem and stay in the loop through monitoring job triggering and successful executions as well as job failures.
Cron To Go offers a range of other tools and functionalities that assist in debugging and managing cron jobs or scheduled tasks on Heroku.
These include:
- Job execution history: View details of previous job executions including status and duration, allowing for effective troubleshooting of failures.
- Monitoring and logging: Monitor job executions and view real-time logs directly from the Cron To Go dashboard to understand job performance and issues.
- Notifications: Receive email notifications regarding job failures and successful completions, helping you stay informed about the job's operational status.
- Webhooks: Configure webhooks to receive real-time updates on job executions, which can be critical for immediate debugging and response.
- View job logs: Access detailed logs for dynos that execute jobs to diagnose issues. This includes logs pulled directly from your app's logs.
- Manual job testing: Test job commands manually via the dashboard to verify setup and functionality, crucial for debugging before setting jobs to run on schedule.
- API access for debugging: Use the API for additional debugging capabilities and deeper integration with your existing tools and workflows.
Stay updated with Cron To Go's status page
We don’t like to toot our own horn, but we hardly experience any downtime, unless AWS crashes. Nonetheless, you should subscribe to our Status page to stay notified in case things do go wrong.
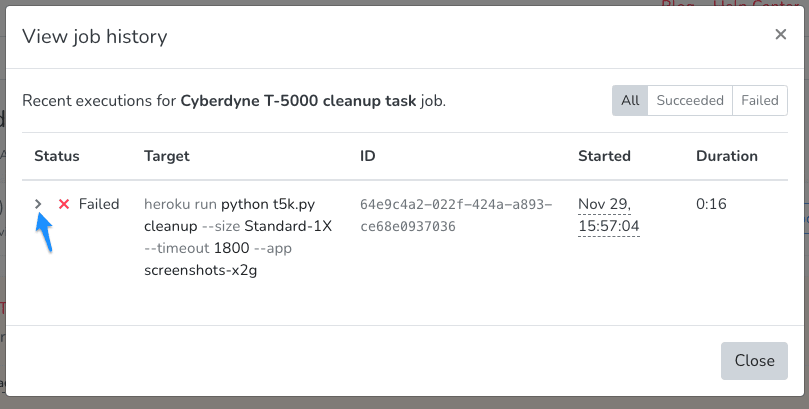
Check job execution history
So you got that dreadful notification, saying that a job has failed! Well, now is a good time to find out what happened. To do so, you can view the cron job’s execution history.
For each execution, you can view the process exit code (anything above 0 is an error) and the error message received from Heroku by clicking the Actions item on the job and then View job history. Then, expand the failed execution.
Monitor Heroku status for cron job issues
Sometimes, you can blame Heroku for the errors. It may be that the service is temporarily unavailable, there may be intermittent errors, or there may be an incident you should track on Heroku’s status page.
Subscribe to it to make sure you’re notified when incidents are acknowledged.
Resolve cron job concurrency issues
In other cases, you may be trying to use dyno types that aren’t available in your app, or you have exceeded the limit of the concurrent number of one-off dynos in your Heroku app. Each dyno type has a different limit.
You can resolve these situations by either changing your job schedules so that you don’t exceed the concurrency limits, improving the performance of your jobs by tuning your code to ensure that job runtime is not too long, or request a limit increase from Heroku.
Streamline job debugging with a logging add-on
More often than not, it is your code that throws an error. The job execution history is able to be retrieved and displays the log from Heroku which should point you to the exception thrown in your code.
However, Heroku only stores up to 1,500 log lines, so if your app writes a lot of logs or you’re looking at the failed job execution too late, the logs may already be gone.
We recommend adding a logging add-on in order to have your logs stored and indexed, allowing you to quickly look up the right logs by copying the dyno name from the job execution (or even just the job id) and searching for it in your favorite logging add-on.
Test your cron jobs
Once you find the culprit and manage to fix the issue, we recommend that you run the job manually by clicking Actions -> Run Job Now to double check that the job is running correctly.
We hope this guide was able to help you find solutions or prepare you for the mentioned scenarios. Remember that being prepared is the key to resilience and getting back on track.
If you have any questions or can use our help with anything, don’t hesitate to reach out.
Frequently Asked Questions
What is a cron debugger?
A cron debugger is a toolset that helps you diagnose and fix problems with scheduled tasks, or cron jobs. It makes monitoring and troubleshooting easier. Cron To Go provides these helpful features.
How does a cron debugger help with Heroku scheduled tasks?
A cron debugger helps manage Heroku scheduled tasks by giving you insights into job history, error messages, and performance. With tools like those from Cron To Go, you can track and fix issues, monitor job status, and get notifications about failed jobs.
Can Cron To Go be used to debug scheduled tasks?
Yes, Cron To Go offers features that help debug scheduled tasks. These include automated email notifications, webhook notifications, job execution history, and logging add-ons to help you diagnose and fix issues on Heroku.
What are the benefits of using Cron To Go's features?
Using Cron To Go helps you proactively detect issues, track errors, quickly resolve problems, and improve the reliability of your scheduled tasks. It keeps your cron jobs running smoothly with comprehensive monitoring and troubleshooting tools.
How do webhook notifications help with debugging cron jobs?
Webhook notifications from Cron To Go alert you to job events, successful executions, and failures in real time. This makes it easier to quickly identify and fix any issues.
Why is logging important in a cron debugger?
Logging keeps detailed records of job executions, including errors and system outputs. Cron To Go’s logging add-ons are essential for diagnosing issues, understanding job behavior, and ensuring effective problem resolution.